Understanding churn is a top 5 issue for most of our clients, and maybe should be for almost everyone.
What Do You Mean Churn?
The first big question though is pulling apart what churn is. Saying, “We’ve got churn of 20%” is a meaningless statement all by itself. Let me explain.
One important first step when analysing churn is to separate cohorts. This way you can separate what’s happening with newer versus older customers. This is usually done by year, but it could be shorter for some products where you expect a second purchase in days or weeks.
Next you take each cohort and look at that cohort every year by volume, value and average value.
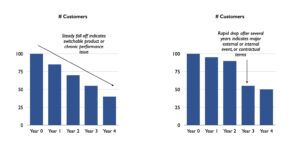
You usually get something like this for any year’s cohort.

Low value customers drop off in year one, but after that people are quite loyal and can even increase their spend year on year for a few years. Average churn is the net effect of overlaying these cohorts, but for most products understanding churn at a cohort level is where the action is.
The drop off in year one, or after the first purchase, is very common. There’s a number potential reasons this happens, each of which has very different consequences:
- You have a lead in product, like a health check, that either creates more business or it doesn’t
- You have a product mix of one off type products and recurring products
- You’ve got a very narrow product range so opportunities for additional purchase are limited after the first one
- You’re terrible at onboarding and getting customers to engage with your product
- You concentrate service on the high value customers
- Customers qualify the product in or out in the first year and they either find it valuable or they don’t
- Your sales people sell any old stuff in the last quarter to hit their targets
- etc, etc
In this situation, once you layer the cohorts, you should see a gradual reduction in churn as older cohorts become a bigger part of the mix. So 20% net churn in a new business offering a new type of product is much less worrying than in, say, a football club founded in 1875.
If you don’t have the drop off in year one, this hints at another dynamic, which needs reviewing on its own merits.
We’ll get to finding out the causes later. But this cohort analysis separates out information to give you insights and hints at the problem that aggregated data can’t.
You can even go further and do the same analysis by customer type or size, to isolate who’s churning. But that often comes out of intelligent observation of the cohort analysis of all customers.
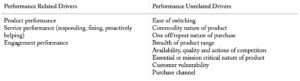
What Drives Loyalty, or Churn?
Churn isn’t totally driven by your product and service performance. There’s a host of potential drivers, many of which are out of your control operationally. These need to be either accepted as part of the game or addressed strategically with your choices of which markets you play in and how.
How to Understand Those Drivers of Churn
As usual, getting to the bottom of this issue is about analysing the data properly and having intelligent conversations with the right customers. It’s also about knowing what a reasonable standard is because you could be making a crazy economic decision trying to get churn to levels that no one can sustain.
Analysing Internal Data
If you have internal data on why people left, it’s very tempting to look at churned customers, find out the big issues they faced before they left, and conclude that you need to fix those issues. Here’s a simple example:
- 80% of people who left had issue X
- 20% of people who left had issue Y
- 10% of people who left had issue Z
(People can have multiple issues so it can add to more than 100%.)
It’s easy to conclude that we need to work on issue X, the big driver of churn. But what if 80% of the entire customer base had issue X and most of them didn’t leave? Is it still as important to fix? Is it still a driver of churn? If it isn’t, then what explains churn if the other reasons only add up to a gross 30%?
What if everyone who had issue Y left, even though it was only 20% of total leavers? Does Y become the more important issue to fix?
Maybe issues faced by customers aren’t that important. Did the churned customers have different characteristics to the retained, and it’s nothing to do with issues they face? Are they much smaller? Do they buy through a different channel? Are they mainly from purchasing roles and the retained ones are from operations?
I hope this shows that categorising issues faced by churned customers isn’t anywhere near enough to understand the drivers. It’s why it’s important to look at customer characteristics and to compare issues faced by leavers to the base rates across the entire customer base. I also hope it shows why this kind of analysis only gives you hints about what’s important in churn.
Talking to Customers
This is where the action is and where you can end the second guessing of reasons for churn.
You need proper, in depth conversations with a good sample of churned customers and retained customers who faced the same issue. This is hard to do, and can take weeks, but you need to do it. You need to talk with them about what happened, what they did, and why they left or stayed. If you do it well, they open up and give you gems of insight that don’t come out of leaver surveys. They often don’t care about things you thought were essential. They often leave because of things you didn’t even think about.
This knowledge alone lets you target the handful of things you need to address to get churn to sustainably low levels. And it gives you an investment return that outmatches almost anything else you can do. We’ve had clients commission only this interviewing exercise, implement changes to address issues from the interviews, be nominated for service prizes as soon as a year later, retain big customers who would have left, and reduce their churn from well outside to well inside target in the process.
Given the business and operational value of a few points difference in churn, it’s an exercise doing often and doing well.


