
Working out market growth is placing a bet on a not-so-well-known future. But in most situations it’s a very important bet and worth much more thought than it typically gets.
As always, it’s worth asking a couple of context setting questions before trying to work out growth to the nearest percent.
- Is market growth actually important to my growth plans?
- How precise do I need to be precise in estimating it?
Is Market Growth Important?
There are plenty of situations in which market growth isn’t important. For breakthrough, next generation or substitute products, the penetration of a legacy installed base is much more important. Knowing market growth also isn’t important where it’s so obviously high that other things, such as capacity or recruiting, are constraints.
But in most situations knowing market growth is very important. Directly, you need to know if the market is providing a fair wind to your own target growth. Indirectly, high growth and asset constrained markets have lower competitive intensity, lower customer acquisition costs, and higher margins.
Do I Need to Estimate Growth Precisely?
Sometimes need to know the market growth precisely. Sometimes you just need a ball park.
You need to be pretty precise and confident when your growth expectations are roughly at market growth rate. You need that fair wind. Also, you typically need to be precise in low growth markets. Here a 2 or 3% error can be the difference between market growth and stagnation or decline.
In high growth markets, where your growth expectations are below market growth rate, or where you’re genuinely constrained by other things such as supply or capacity, then a ball park is all you need.
How to Work Out Market Growth
There 5 main ways to work out market growth, each of which has its role and track record of accuracy.

History Forward
Taking a historical trend and projecting it forward sounds simple but is easy to get wrong. This is usually because people use historical growth rate for their projections without giving it any further thought.
Historical growth rates are typically fine for maturing and mature markets growing in single digits. Using historical growth rates in new markets leads to overestimates. This is because most markets start off growing in high double or even triple digits and their growth rate slows each year. Here’s an example of a market that starts of growing at 20%, and slows by a percentage point each year. I.e., it takes 15-16 years to mature.

If we look at growth in the market from year 6 to 10, and use the average annual growth rate from the previous 3 years or 5 years to project forward growth, look how far out we are by year 10. Also notice how using the average quantum growth from the previous 3 or 5 years gives a decent conservative estimate.
This is why a lot of the time we prefer to projected forward using historical quantum growth as a conservative case.
There’s a few other points worth considering with this approach:
- The start year you choose for your calculation has a big effect. This will be critical in these next couple of years as we still see the effects of Covid dips and bounces. There’s judgement required here and the objective is to choose a start date that shows a trend representative of what’s happening now
- Markets always have drivers, such as legislation, taxation policy, etc. Sometimes these change to either mitigate or accelerate historical growth. This is why it’s always important to do a market drivers analysis in conjunction with analysing growth
- If you have the right deflator to use real rather than nominal market growth. It’s worth doing in these times of up and down inflationary price pressures. But make sure to use the deflator that’s relevant for the market you’re looking at
Correlation
For those who haven’t done correlation before, the process is to correlate the market with some other factor that you can project with confidence, for example GDP. You work the relationship between your market size and say GDP. Then you can use those GDP forecasts to project your market.
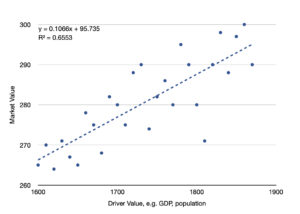
The correlation itself is very interesting and useful information. The r-squared, or closeness of fit, of the correlation tells you a lot, as does the beta, or slope of your correlation line. For example, a market that’s closely correlated with GDP and with a beta greater than 1.2 should expect some pretty serious cyclical ups and downs. A relationship with an r-squared of less than 0.7 is a pretty loose relationship. You’ll need to treat your projections from it with a broad range of error and a pinch of salt.
Try not to get too clever with correlations. You don’t have a separate data set to validate your correlation relationship, so stick to simple relationships: linear or logarithmic. No exponents, no multivariate quadratics.
Also, do make sure you’re correlating against something that you can predict with some degree of reliability. A great correlation with something that you can’t predict reliably is worse than a waste of time. Here’s some examples of variables that people use a lot for correlations and projections, together with how accurate their forecasts turn out to be.

Direct Drivers
Direct drivers are the gold standard of market forecasting. Here, you know with a large degree of confidence what drives your market and to what degree. You also need to be able to predict that driver very reliably. It’s similar to correlation but with the additional confidence of some degree of causation.
An example is tequila market volumes. Here we know how many agave plants have been planted each year, how long they take to mature, what their weight will be in the different regions, and the yield of tequila from each kilo of agave.
A more typical example is medical equipment for age related conditions such as aortic stenosis. We know with a lot of confidence the propensity for the condition in each age band and can predict relatively accurately how the size of each age demographic will change each year. This gives us lots of confidence in our market volume projections.
Where we have a direct driver model for market growth, we are typically very confident in it to the nearest percentage point. We rarely have a need for any other approach to verify it.
Market Research
If market research reports exist always look at them and potentially use their findings but, as with using market researchers for market size, only with conditions:
- Only pay attention to credible researchers. There are so many newer research companies churning out reports that it’s difficult to be confident about their thoroughness. And the new market research providers almost always over estimate market growth. You need to know who is credible and who isn’t before even bothering to look at their estimates
- Check against historicals. Market research reports do occasionally contain historical years, and it’s worth checking forecasts against those. If they don’t then that’s an alarm bell and you should find some historicals to see if the projected growth makes sense
- Call them up to find out how they did their calculations. If you buy their report they will talk to you. As with market researchers for market size, some are impressively rigorous and thoughtful. Others make you worry
- Look at previous years’ reports to see how accurate they were. Looking at market researchers’ previous years reports is a sobering exercise. With some excellent exceptions, market growth projections are typically wrong to a significant extent, and almost always over estimates
- When you have multiple sources, use the credible ones as central and upper bounds, ignore the non credible, and use your own lower bound. Market researchers are almost never conservative about market size, and are often optimistic. You will have to run your own conservative case
- Always, always do your own sense check and self calculation. You should be in the same ball park as the more credible market researchers for your less conservative case. Again, if not then something is wrong with the market research or with your market growth calculations
Policy Targets
Policy targets are a useful tool for understanding incentives and which areas will grow fastest. But the targets themselves are close to useless except to use as a most optimistic possible scenario. This is the case even when targets are “legally binding.” For example, NHS targets on elective operation wait times have predictably driven down numbers waiting the longest times for operations. But the legally binding wait list target has been missed, and the total wait lists remain unaffected.
When we see policy targets as a justification for size or growth of a market, we use it as a useful alarm bell on those forecasts.
Science Plus Judgement
Forecasting market growth is as much about judgement as it is about science. But estimating it well for your purposes is typically very important, much more so than other things like knowing market size. This is why it’s essential to think first about why it’s important to you and what level of accuracy you need. It’s also why you should work it out for yourself when you can. And please don’t do what 90% of people do: quote the market research or policy target number and expect it to come true.


