
Typical Mid Market Approaches
Mid market companies typically take a fairly straightforward approach to revenue forecasting
- For the short term, a combination of recurring and repeat revenues, plus some form of probability weighted pipeline. For most companies this covers the remainder of financial year and possibly a few months into the next. But its longer for companies with more extended sales cycles
- Then for more sophisticated companies, use of a bunch of internal drivers of revenue to work up growth in the outer years. Drivers are usually one or more of number of sales people, marketing spend, new product releases or product mix changes, and an additional effect of new territories or other new markets
- For less sophisticated companies, mid and long term projections are based on a combination of past growth and management intuition about achievable targets for each product group or market
Investors, and management in its internal downside case, then dial this down. They do this using some form of conservative or very conservative reasoning, depending on the situation they want to get comfortable about in their revenue forecasting.
Problems with the Typical Approach
This approach has the very important benefit of simplicity. And investors and management teams have well developed experience of how much to dial down revenue targets for their conservative cases. But it has two very big drawbacks:
- It still leads to targets that are too high. In a survey of CDD providers we performed, 80% of their portfolio companies were behind target revenues by year 2. Human beings perform best when their targets are a mild stretch that they hit 80% of the time if they work hard, not the other way around
- It doesn’t give management or investors confidence in what really are the essential drivers of revenue growth, so they don’t know what big things to focus on. They also don’t have any early warnings and plan of action when things start going less well
A Simple Analytical Approach to Revenue Forecasting
Mid market companies are becoming more data rich. But most don’t have the data to use the more sophisticated and insightful approaches to analyse drivers and support forecasting.
Given these data constraints, a simpler approach to making or testing forecasts is usually best:
- Understand actual revenue drivers and use historical values for them. Typically one or two factors drive revenues more than everything else put together. These can range from numbers of salespeople and marketing spend to new product releases and added services. There’s usually history on these factors to work things out. Some machine learning tools such as Lasso are actually quite good at identifying the big ones and their effects. But simpler correlations work just fine. This analysis of history helps us be realistic when we add those 10 new sales people and don’t expect them all to still be around and match the experienced staff who took 2 years to build their capability
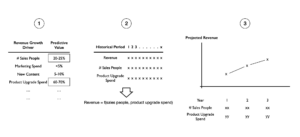
Please resist the temptation here to do a complex multivariate regression including every important driver you can think of. This has the big drawback of something called over fitting and results in garbage projections when using those drivers.
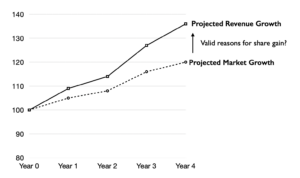
2. Do an outside in check using market growth and trends. If our revenue projections imply massive share gain, then we need to take a reality check and dial our forecasts down to market growth rates, unless there’s a very good reason such as a history of massive share gain or a real change in what we’re doing that we honestly believe will pay off
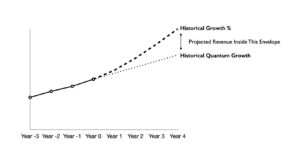
3. Compare with our historical growth. Despite big historical ups and downs by product, aggregate historical revenue growth does seem to be a decent guide to future growth for a range of reasons. The key thing to get right is what we mean by historical growth. Projecting forward at historical growth percentages leads to hockey sticks in the outer years, using average historical quantum growth leads to conservative projections. Our rule of thumb is that, unless the business has changed radically, projections need to be inside the envelope of these two rates and nearer the quantum.
The Benefit of This Approach, and the Real Benefit
The first benefit of this type of revenue analysis is greater confidence in projections, which you can use as a proper target, replacing previous targets that had a big chunk of hope value. But the real benefit is understanding the handful of big drivers of that revenue so you can act ahead of time when life happens and takes things off track.


