
The Typical, Very Simple, Approach to Gross Profit Forecasting
Gross profit is possibly the most important and uncertain line in a P&L to forecast. Depending on the business type, the factors driving the forecast come broken down in one of two ways:
Gross Profit (£ or $) = Revenue (£ or $) x Gross Margin (%)
or
Gross Profit (£ or $) = Volume (units) x GP/Unit (£ or $/unit)
The first half of this equation, either revenue or volume, typically gets a lot of thought. The second and equally important part, not so much.
Here’s what gross margin forecasting usually looks like for the second part of these equations for mid market companies, where you’re often lucky to get 5 years of checked financials.
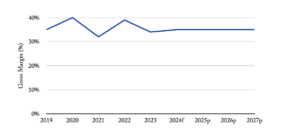
Essentially, management takes this year’s GM% forecast and projects it flat into the outer years. So projected gross profit growth is consequently pretty much driven by projected volume growth in each product line and we hope the gross margin stays flat.
The Reality of Gross Margin Growth
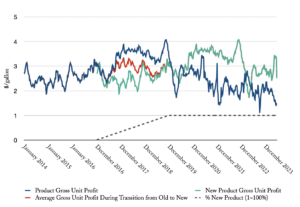
But gross margin growth of a product is rarely flat. Here’s what gross profit growth looks like in a market (details in note 1) over a 10 year period from the early stages of market growth into the still early stages of maturity.

A few things are making this slow decline happen once the market moves out of very early stages::
- Customers are becoming more knowledgeable in the second, third and subsequent purchases and can compare alternatives more easily
- Purchasing moves from operational and business unit staff, typical for newer products, to more experience purchasing staff with greater incentives to look harder at price
- Most importantly, competition increases and competes away those fat margins with better or cheaper products
So is it optimistic and naive, as well as simplistic, to model flat gross margin? Not necessarily.
What Stops Gross Margin Declining (Or Even Makes it Grow)?
There’s a series of factors that hold up or even grow gross margin.
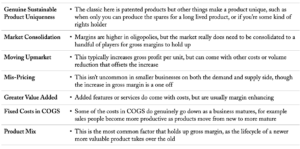
Let’s look at the most common way of holding up gross margin – changing product mix. This is what happens when the next generation product takes over the older one. Here’s the same producer as above but with a simulated new product coming in after 3 years and taking a further 3 years to transition to 100% of sales. The net effect is essentially flat gross margin, as long as you keep up the product development.
Reviewing Gross Margin Forecasting
Projecting flat gross margin for the complete product set is not unreasonable as long as as least one of those margin supporters is there for the bulk of sales. A better way is to reflect the actual margin drivers. For example you could split up the product set into different margin products including planned new ones, put in a slow decline, and see if the change in mix is holding up margin.
You can often still end up with the same simple roughly flat gross margin at the end of this analysis. But the big benefit of all this is pointing the management team towards the things that are going to hold up or even grow that margin. And this what makes the real money that you take to the bank in the real world.
Notes:
[1] Gross profit of US renewable diesel and SAF producer with typical product mix, taking all revenues included traded subsidies and tax credits, net of traded cost of most common feedstock.


